Monday, March 7, 2016

Released - BluePyOpt 0.2 : Leveraging OSS and the cloud to optimise models to neuroscience data

BluePyOpt


The BlueBrain Python Optimisation Library (BluePyOpt) is an extensible framework for data-driven model parameter optimisation that wraps and standardises several existing open-source tools. It simplifies the task of creating and sharing these optimisations, and the associated techniques and knowledge. This is achieved by abstracting the optimisation and evaluation tasks into various reusable and flexible discrete elements according to established best-practices. Further, BluePyOpt provides methods for setting up both small- and large-scale optimisations on a variety of platforms, ranging from laptops to Linux clusters and cloud-based compute infrastructures.

The code is available here:
https://github.com/BlueBrain/BluePyOpt
A preprint to the paper is available here:
http://arxiv.org/abs/1603.00500

Friday, February 26, 2016

Stop plotting your data -- HoloViews 1.4 released!

We are pleased to announce the fifth public release of HoloViews, a Python package for exploring and visualizing scientific data:

   http://holoviews.org

HoloViews provides composable, sliceable, declarative data structures for building even complex visualizations easily.  Instead of you having to explicitly and laboriously plot your data, HoloViews lets you simply annotate your data so that any part of it visualizes itself automatically.  You can now work with large datasets as easily as you work with simple datatypes at the Python prompt.

The new version can be installed using conda:

   conda install -c ioam holoviews

Release 1.4 introduces major new features, incorporating over 1700 new commits and closing 142 issues:

- Now supports both Bokeh (bokeh.pydata.org) and matplotlib backends, with Bokeh providing extensive interactive features such as panning and zooming linked axes, and customizable callbacks

- DynamicMap: Allows exploring live streams from ongoing data collection or simulation, or parameter spaces too large to fit into your computer's or your browser's memory, from within a Jupyter notebook

- Columnar data support: Underlying data storage can now be in Pandas dataframes, NumPy arrays, or Python dictionaries, allowing you to define HoloViews objects without copying or reformatting your data

- New Element types: Area (area under or between curves), Spikes (sequence of lines, e.g. spectra, neural spikes, or rug plots), BoxWhisker (summary of a distribution), QuadMesh (nonuniform rasters), Trisurface (Delaunay-triangulated surface plots)

- New Container type: GridMatrix (grid of heterogenous Elements)

- Improved layout handling, with better support for varying aspect  ratios and plot sizes

- Improved help system, including recursively listing and searching the help for all the components of a composite object

- Improved Jupyter/IPython notebook support, including improved export using nbconvert, and standalone HTML output that supports dynamic widgets even without a Python server

- Significant performance improvements for large or highly nested data

And of course we have fixed a number of bugs found by our very dedicated users; please keep filing Github issues if you find any!

For the full list of changes, see:

   https://github.com/ioam/holoviews/releases

HoloViews is now supported by Continuum Analytics, and is being used in a wide range of scientific and industrial projects.  HoloViews remains freely available under a BSD license, is Python 2 and 3 compatible, and has minimal external dependencies, making it easy to integrate into your workflow. Try out the extensive tutorials at holoviews.org today!

Jean-Luc R. Stevens
Philipp Rudiger
James A. Bednar

Continuum Analytics, Inc., Austin, TX, USA
School of Informatics, The University of Edinburgh, UK

Friday, August 28, 2015

Docker images for neuronal network simulation

I've created some Docker images for biological neuronal network simulations with Python.

The images contain NEST 2.6, NEURON 7.3, Brian 1.4 and PyNN 0.8.0rc1, together with IPython, numpy, scipy and matplotlib.

The images are intended as a quick way to get simulation projects up-and-running on Linux, OS X and Windows (the latter two via the Docker Toolbox, which runs Docker in a VM). They can be used for teaching or as the basis for reproducible research projects that can easily be shared with others.

The images are available on Docker Hub.

To quickly get started, once you have Docker installed, run

docker pull neuralensemble/simulation
docker run -i -t neuralensemble/simulation /bin/bash

then inside the container

source ~/env/simulation/bin/activate

For ssh/X11 support, use the "simulationx" image instead of "simulation". Full instructions are available here.

I plan to add further images for neuroscience data analysis, providing Neo, Elephant, OpenElectrophy, SpykeViewer, the G-Node Python tools, KlustaSuite, etc. If anyone would like to help out, or suggest other tools that should be installed, please contact me, or open a ticket on Github.

Friday, July 3, 2015

Sumatra 0.7 released

We would like to announce the release of version 0.7.0 of Sumatra, a tool for automated tracking of simulations and computational analyses so as to be able to easily replicate them at a later date.

This version of Sumatra brings some major improvements for users, including an improved web browser interface, improved support for the R language, Python 3 compatibility, a plug-in interface making Sumatra easier to extend and customize, and support for storing data using WebDAV.
In addition, there have been many changes under the hood, including a move to Github and improvements to the test framework, largely supported by the use of Docker.
Last but not least, we have changed licence from the CeCILL licence (GPL-compatible) to a BSD 2-Clause Licence, which should make it easier for other developers to use Sumatra in their own projects.

Updated and extended web interface

Thanks to Felix Hoffman’s Google Summer of Code project, the web browser interface now provides the option of viewing the history of your project either in a “process-centric” view, as in previous versions, where each row in the table represents a computation, or in a “data-centric” view, where each row is a data file. Where the output from one computation is the input to another, additional links make it possible to follow these connections.
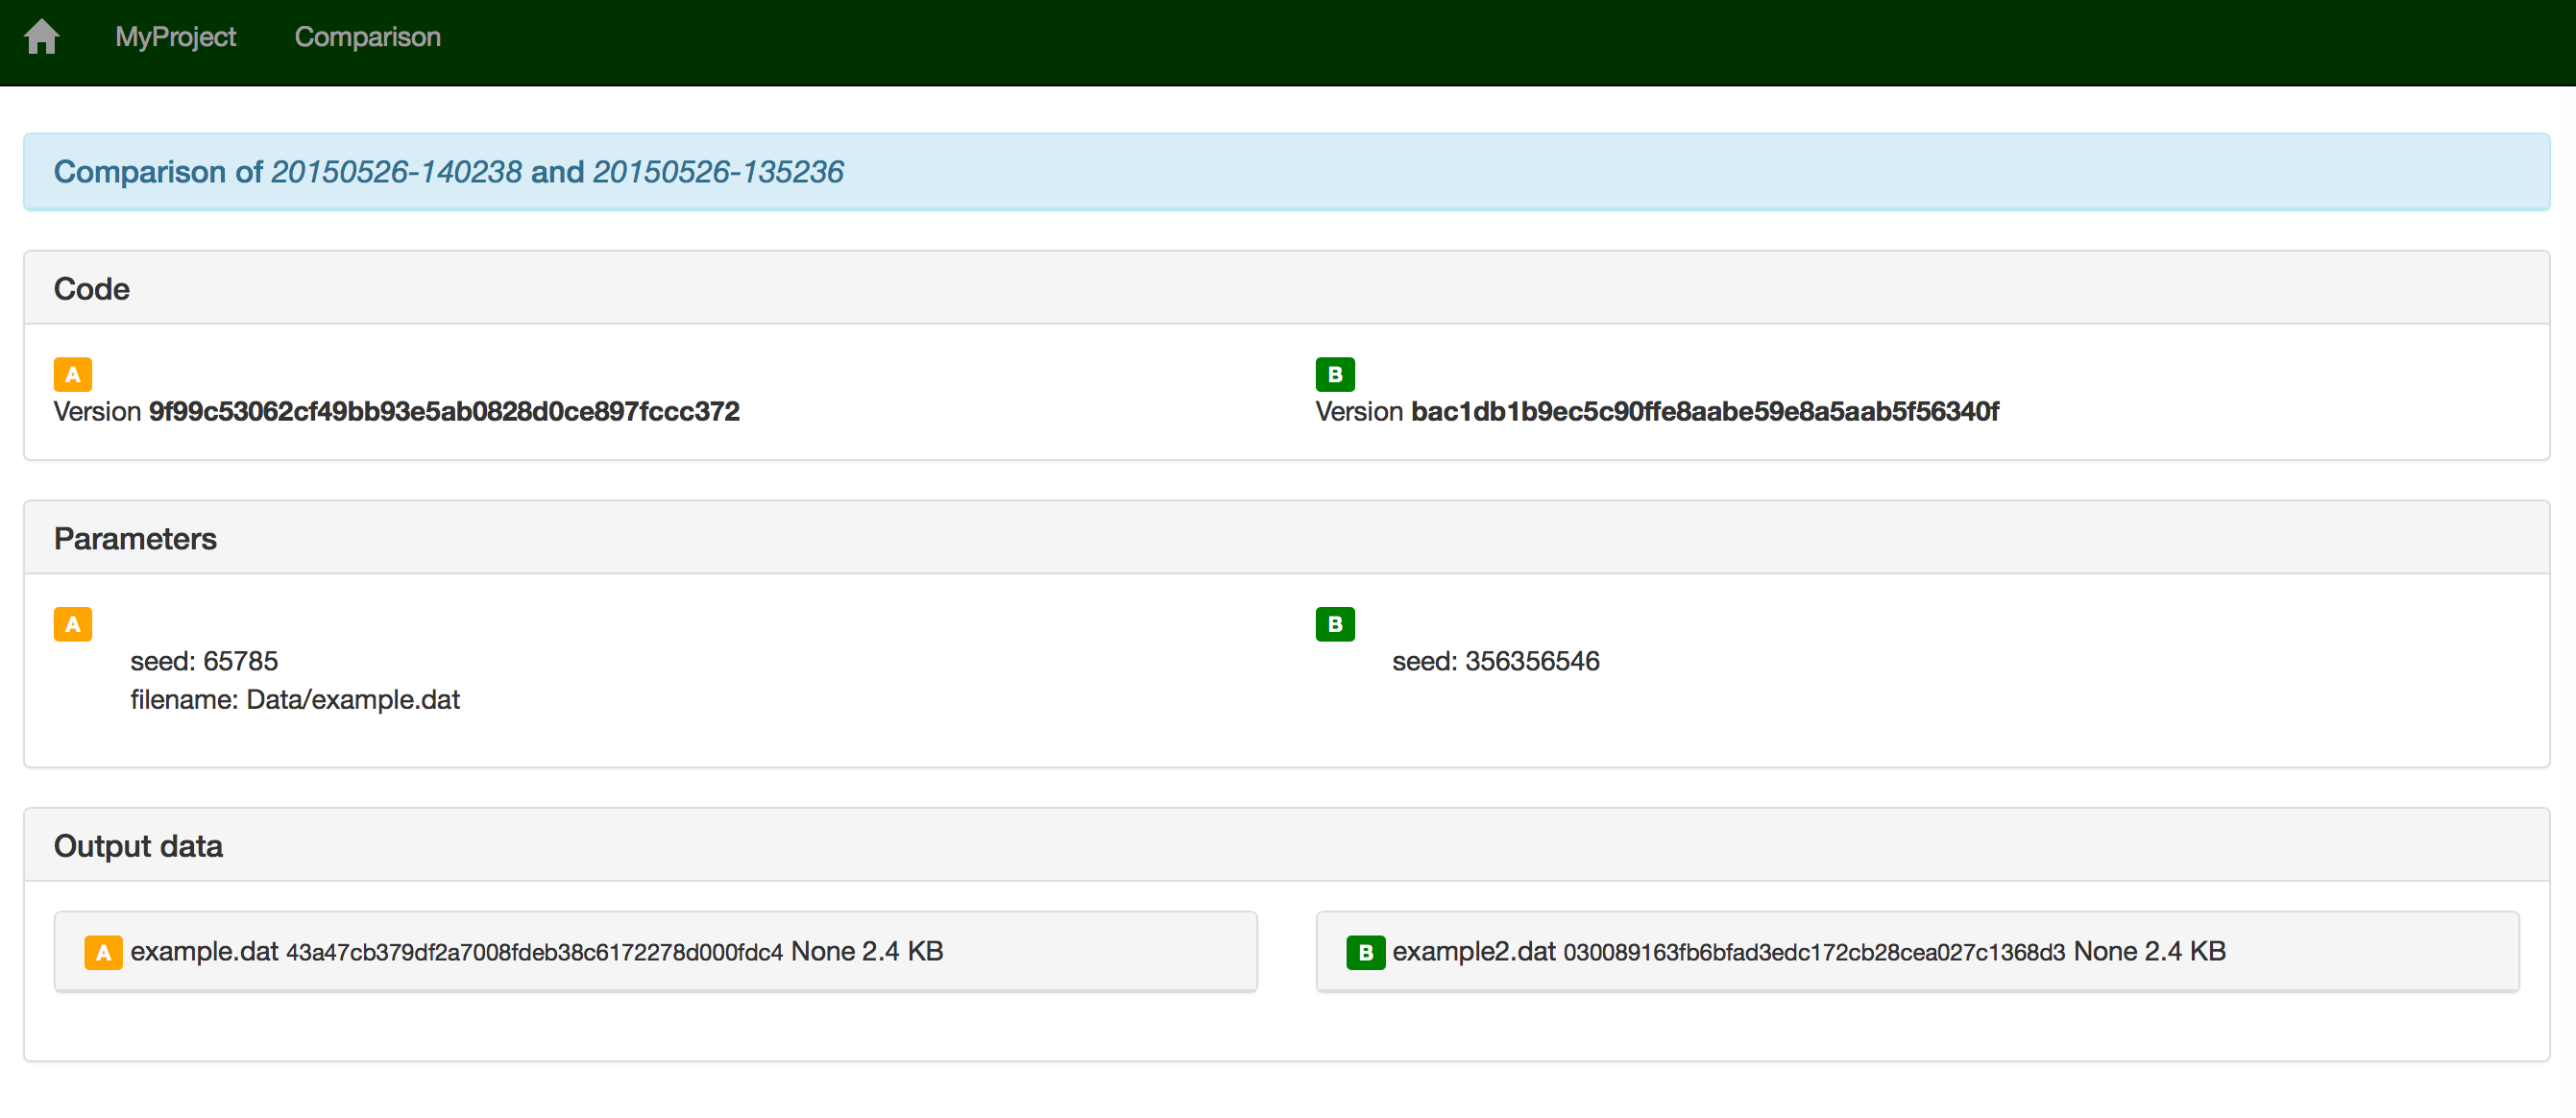
The web interface has also had a cosmetic update and several other improvements, including a more powerful comparison view (see screenshot). Importantly, the interface layout no longer breaks in narrower browser windows.
../_images/compare_records.png

BSD licence

The Sumatra project aims to provide not only tools for scientists as end users (such as smt and smtweb), but also library components for developers to add Sumatra’s functionality to their own tools. To support this second use, we have switched licence from CeCILL (GPL-compatible) to the BSD 2-Clause Licence.

Python 3 support

In version 0.6.0, Sumatra already supported provenance capture for projects using Python 3, but required Python 2.6 or 2.7 to run. Thanks to Tim Tröndle, Sumatra now also runs in Python 3.4.

Plug-in interface

To support the wide diversity of workflows in scientific computing, Sumatra has always had an extensible architecture. It is intended to be easy to add support for new database formats, new programming languages, new version control systems, or new ways of launching computations.
Until now, adding such extensions has required that the code be included in Sumatra’s code base. Version 0.7.0 adds a plug-in interface, so you can define your own local extensions, or use other people’s.
For more information, see Extending Sumatra with plug-ins.

WebDAV support

The option to archive output data files has been extended to allow archiving to a remote server using the WebDAV protocol.

Support for the R language

Sumatra will now attempt to determine the versions of all external packages loaded by an R script.

Other changes

For developers, there has been a significant change - the project has moved from Mercurial to Git, and is now hosted on Github. Testing has also been significantly improved, with more system/integration testing, and the use of Docker for testing PostgreSQL and WebDAV support.
Parsing of command-line parameters has been improved. The ParameterSet classes now have a diff() method, making it easier to see the difference between two parameter sets, especially for large and hierarchical sets.
Following the recommendation of the Mercurial developers, and to enable the change of licence to BSD, we no longer use the Mercurial internal API. Instead we use the Mercurial command line interface via the hgapi package.

Bug fixes

A fair number of bugs have been fixed.

Download, support and documentation


The easiest way to get the latest version of Sumatra is

  $ pip install sumatra

Alternatively, Sumatra 0.7.0 may be downloaded from PyPI or from the INCF Software Center. Support is available from the sumatra-users Google Group. Full documentation is available on Read the Docs.

Wednesday, April 8, 2015

Elephant 0.1.0 released

We are pleased to announce the first release of the Elephant toolbox for the analysis of neurophysiology data.

Elephant builds on the Python scientific stack (NumPy, SciPy) to provide a set of well-tested analysis functions for spike train data and time series recordings from electrodes, such as spike train statistics, power spectrum analysis, filtering, cross-correlation and spike-triggered averaging. The toolbox also provides tools to generate artificial spike trains, either from stochastic processes or by controlled perturbations of real spike trains. Elephant is built on the Neo data model, and takes advantage of the broad file-format support provided by the Neo library. A bridge to the Pandas data analysis library is also provided.

Elephant is a community-based effort, aimed at providing a common platform to test and distribute code from different laboratories, with the goal of improving the reproducibility of modern neuroscience research. If you are a neuroscience researcher or student using Python for data analysis, please consider joining us, either to contribute your own code or to help with code review and testing.

Elephant is the direct successor to NeuroTools and maintains ties to complementary projects such as OpenElectrophy and SpykeViewer. It is also the default tool for electrophysiology data analysis in the Human Brain Project.

As a simple example, let's generate some artificial spike train data using a homogeneous Poisson process:

from elephant.spike_train_generation import homogeneous_poisson_process
from quantities import Hz, s, ms
spiketrains = [
    homogeneous_poisson_process(rate=10.0*Hz, t_start=0.0*s, t_stop=100.0*s)
    for i in range(100)]

and visualize it in Matplotlib:

import matplotlib.pyplot as plt
import numpy as np
for i, spiketrain in enumerate(spiketrains):
    t = spiketrain.rescale(ms)
    plt.plot(t, i * np.ones_like(t), 'k.', markersize=2)
plt.axis('tight')
plt.xlim(0, 1000)
plt.xlabel('Time (ms)', fontsize=16)
plt.ylabel('Spike Train Index', fontsize=16)
plt.gca().tick_params(axis='both', which='major', labelsize=14)
plt.show()_images/tutorial_1_figure_1.png
Now we calculate the coefficient of variation of the inter-spike interval for each of the 100 spike trains.

from elephant.statistics import isi, cv
cv_list = [cv(isi(spiketrain)) for spiketrain in spiketrains]

As expected for a Poisson process, the values cluster around 1:

plt.hist(cv_list)
plt.xlabel('CV', fontsize=16)
plt.ylabel('count', fontsize=16)
plt.gca().tick_params(axis='both', which='major', labelsize=14)
plt.show()

_images/tutorial_1_figure_2.png

Wednesday, April 1, 2015

ANN: HoloViews 1.0 data visualization and ImaGen 2.0 pattern generation in Python

We are pleased to announce the first public release of HoloViews, a free Python package for scientific and engineering data visualization:

     http://ioam.github.io/holoviews

and version 2.0 of ImaGen, a free Python package for generating two-dimensional patterns useful for vision research and computational modeling:

     http://ioam.github.io/imagen

HoloViews provides composable, sliceable, declarative data structures for building even complex visualizations of any scientific data very easily.  With HoloViews, you can see your data as publication-quality figures almost instantly, so that you can focus on the data itself, rather than on laboriously putting together your figures.  Even complex multi-subfigure layouts and animations are very easily built using HoloViews.

ImaGen provides highly configurable, resolution-independent input patterns, directly visualizable using HoloViews but also available without any plotting package so that they can easily be incorporated directly into your computational modeling or visual stimulus generation code.  With ImaGen, any software with a Python interface can immediately support configurable streams of 0D, 1D, or 2D patterns, without any extra coding.

HoloViews and ImaGen are very general tools, but they were designed to solve common problems faced by vision scientists and computational modelers.  HoloViews makes it very easy to visualize data from vision research, whether it is visual patterns, neural activity patterns, or more abstract measurements or analyses.  Essentially, HoloViews provides a set of general, compositional, multidimensional data structures suitable for both discrete and continuous real-world data, and pairs them with separate customizable plotting classes to visualize them without extensive coding.

ImaGen 2.0 uses the continuous coordinate systems provided by HoloViews to implement flexible resolution-independent generation of streams of patterns, with parameters controlled by the user and allowing randomness or other arbitrary changes over time.  These patterns can be used for visual stimulus generation, testing or training computational models, initializing connectivity in models, or any other application where random or dynamic but precisely controlled streams of patterns are needed.

Features:

- Freely available under a BSD license
- Python 2 and 3 compatible
- Minimal external dependencies -- easy to integrate into your workflow
- Declarative approach provides powerful compositionality with minimal coding
- Include extensive, continuously tested IPython Notebook tutorials
- Easily reconfigurable using documented and validated parameters
- Animations are supported natively, with no extra work
- Supports reproducible research -- simple specification, archived in an IPython Notebook, providing a recipe for regenerating your results
- HoloViews is one of three winners of the 2015 UK Open Source Awards

To get started, check out ioam.github.io/holoviews and ioam.github.io/imagen!

Jean-Luc Stevens
Philipp Rudiger
Christopher Ball
James A. Bednar

Thursday, March 12, 2015

Students: spend the summer improving brain research software tools in Google Summer of Code

From Malin Sandström at the INCF:

Are you a student interested in brain research and software development? Or do you know one?
This year again, INCF is participating as mentoring organization in the Google Summer of Code, a global program that offers students stipends to spend the summer writing code for open source projects. INCF has 27 project proposals offered by mentors from the international research community, many of them with a computational neuroscience slant. All projects deal with development and/or improvement of open source tools that are used in the neuroscience community.

You can see our full list of projects here: https://incf.org/gsoc/2015/proposals

To be eligible, students must fulfill the Google definition of 'student': an individual enrolled in or accepted into an accredited institution including (but not necessarily limited to) colleges, universities, masters programs, PhD programs and undergraduate programs.

Student applications open on Monday, March 16.

GSoC questions welcome to: gsoc@incf.org